
The graph above does a good job of explaining a good job of showing what a real business cycle with date would look like but does not have any vocab on it.
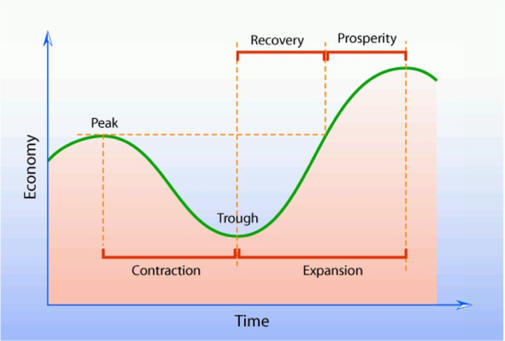

I have choosen this graph for the best Business Cycle award. It does a great job of really explaining to someone how the business cycle works. Besides this graph using all the correct vocab it just really stands out. It has dotted lines and is very colorful so it grabs your attention.

This graph shows the vocab but in a great depth. Nothing really stands out in this graph and it is just boring.
No comments:
Post a Comment